How to Read Contour Lines on a Topographic Map
Learn how to read contour lines on a topographic map and use their spacing and shape to compare slopes, locate ridges and valleys, and plan a clearer route.
Learn how to read contour lines on a topographic map and use their spacing and shape to compare slopes, locate ridges and valleys, and plan a…
Geography · 6 min read
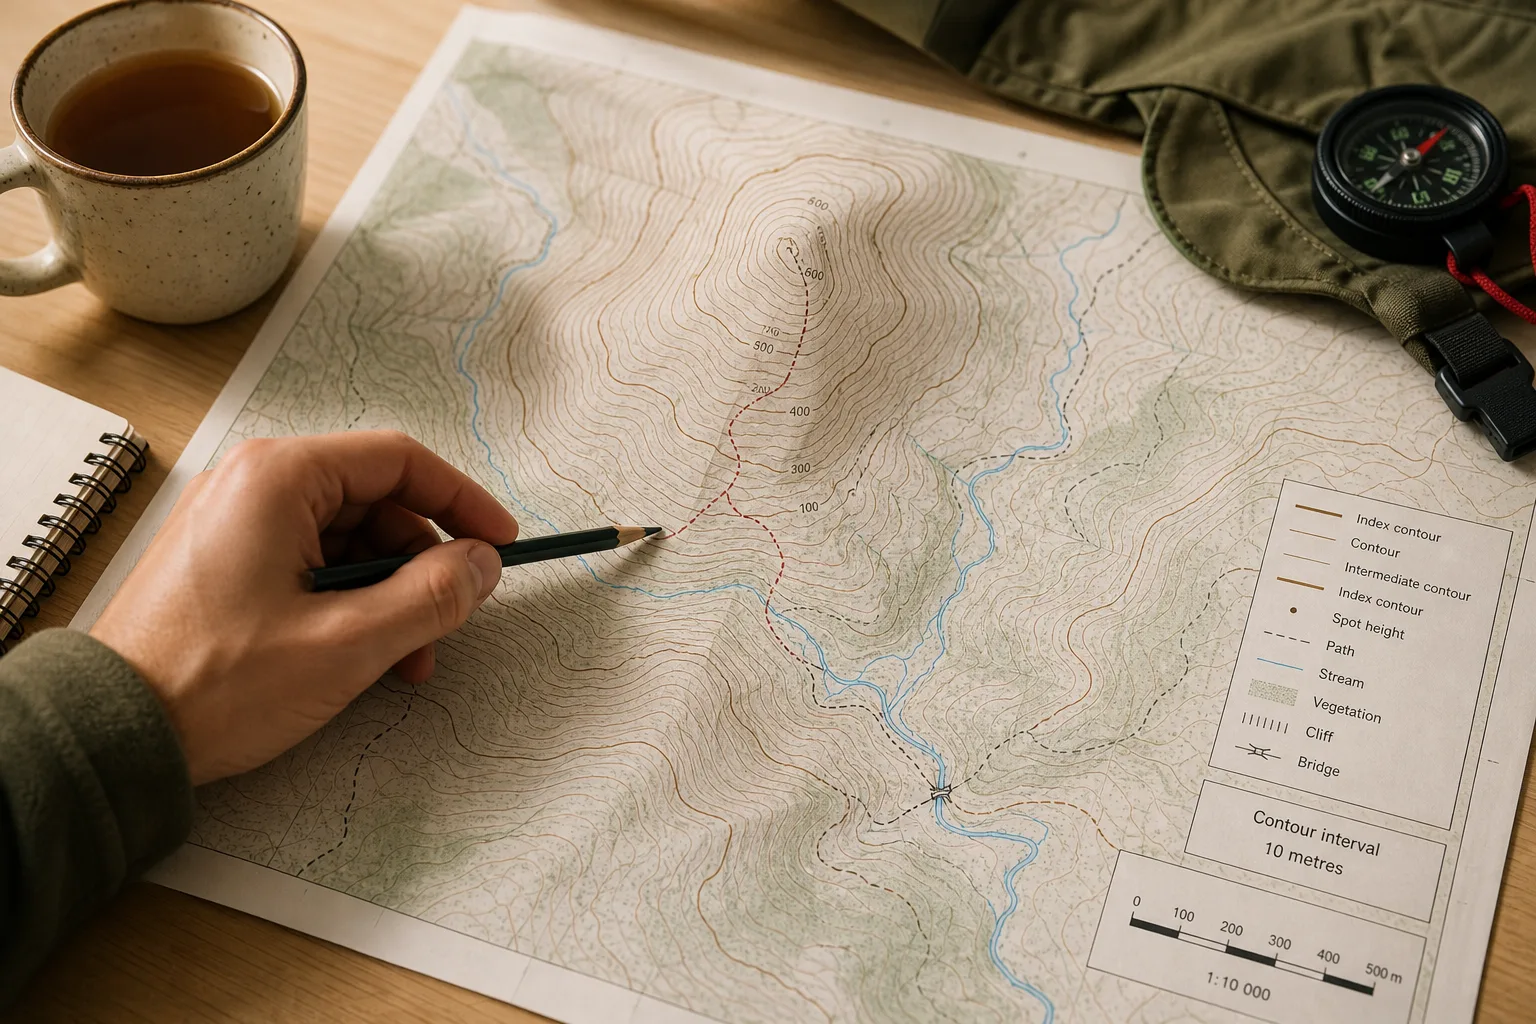
You spread a topographic map beside a mug of tea and trace a footpath towards a hill. The brown lines bunch near the summit, then open out beside a stream. Knowing how to read contour lines on a topographic map helps you interpret those patterns without mistaking a map symbol for the ground itself.
A contour line joins places at the same elevation above the map’s reference level. The lines represent selected height intervals, not every change in the land. Read their spacing, bends and labels together, and check the legend because conventions and line styles vary between maps.
Check the contour interval before judging a slope
The contour interval is the vertical change between ordinary adjacent contours. Find it in the map key or margin before counting lines. Two maps can use different intervals, so the same-looking gap between contours does not necessarily represent the same change in elevation.
Some maps draw index contours more heavily and label them with elevations. Lighter intermediate contours show the steps between those labelled lines. If the interval is stated as a hypothetical 10 metres, for example, moving across three ordinary intervals represents a 30-metre change in elevation. That is a map-reading calculation, not a claim about any particular place.
Contours describe a simplified model of the terrain. The map’s scale, survey detail and chosen interval affect which features appear. Small banks, ditches and bumps may be omitted, so do not read a blank patch as proof of smooth ground.
Use contour spacing to compare gradients
Where contours are close together, the mapped ground gains or loses height over a shorter horizontal distance than where they are spread out. That indicates a steeper gradient. Wider spacing indicates a gentler gradient, not level ground.
Compare spacing within the same map and check the interval first. A route crossing several tightly packed contours is likely to climb or descend more sharply than one crossing fewer, widely spaced lines. The pattern cannot tell you whether either slope is firm, slippery, overgrown or exposed.
Contour spacing can also change along one slope. Lines may spread across a shoulder and crowd near a steeper face. Treat that change as a clue about the broad shape, then consider mapped paths, streams and other symbols separately.
Read bends alongside elevations and watercourses
Contour bends help show how high ground and low ground connect. A bend associated with a valley generally points towards higher ground; a ridge or spur projects away from higher ground, so its contours generally point downhill. These patterns can be difficult to distinguish in complex terrain. Trace neighbouring contours and use elevation labels and mapped watercourses as additional clues.
A stream often follows a valley floor, but a valley may be dry, seasonal or too small to appear at the map’s scale. Likewise, a ridge shape does not show whether its crest is walkable. The legend explains the map’s symbols; it cannot supply details that the map has not recorded.
A closed contour loop often marks a hill. Some maps use inward-pointing hachures to mark a depression instead. Check the hachures, elevation labels and legend before deciding what the loop represents.
Compare routes using the map pattern
Look across contours where a route crosses a slope, then follow them along the route to see how the terrain changes. A path running roughly alongside contours may keep to a similar elevation for a stretch, while one crossing many close lines is likely to gain or lose height more sharply.
Say you are comparing two routes on an invented map with a stated 10-metre contour interval. Route A crosses four intervals over a short slope, a mapped total change of 40 metres; Route B crosses two intervals over a longer traverse, a mapped change of 20 metres. You choose Route B to avoid the sharper mapped climb, while noting that its extra distance and unknown surface conditions remain trade-offs. The figures describe this invented map only, not a real route.
Before choosing, use this map-reading checklist. For each observation, make the stated decision or take the alternative action:
- Contour interval: Check the key for the ordinary interval; if it is clear, use it when counting elevation changes, but if it is missing or ambiguous, do not infer a height total from line count.
- Elevation labels: Check the labelled index contours and spot heights; if they support the direction of ascent, note the higher ground, but if labels are absent or obscured, treat the direction as uncertain.
- Line spacing: Compare the route’s crossings with nearby contours; if they are tightly packed, mark a likely steeper section, but if they are widely spaced, expect a gentler mapped gradient rather than flat ground.
- Contour bends: Check neighbouring bends for a ridge, valley or saddle; if the pattern is supported by elevations or watercourses, use it to understand the landform, but if clues conflict, leave the feature unidentified.
- Map symbols: Check the legend for streams, paths, cliffs and special contour styles; if a symbol is explained, use it according to the key, but if it is not explained, do not assume its meaning.
- Map scale and date: Check the scale and publication or revision information; if the map is suitable for the area and current enough for your purpose, use its detail cautiously, but if not, consult a more appropriate map or local access information.
- Digital display: Check the map source and available detail when zooming; if new labelled features appear, inspect them, but if the image only enlarges, do not treat the display as added terrain detail.
Contour lines support route comparison, not a complete judgement of difficulty or access. A path may be closed, a stream crossing may be difficult, and mapped ground cover may not reflect present conditions. Consult suitable local information for access and conditions; if a route raises safety concerns, seek advice from a qualified local professional or authority.
Why can contour patterns be difficult to interpret?
Does a closed contour always mark a hill?
No. A closed loop often represents a hill, while inward-pointing hachures can represent a depression on maps that use that convention. Check the elevation labels and legend before interpreting the loop.
Can contour lines show whether a path is safe?
No. They indicate elevation and broad terrain shape, not surface quality, vegetation, exposure, access or current path conditions. Use the map to understand the landform, then consult appropriate local information before making a safety-sensitive decision.
Why do some contour lines look crowded?
Close spacing can indicate a steep gradient, but line styles, labels and supplementary contours can also make a map look busy. Check the key before counting lines, and remember that small features may be simplified or omitted.
Does zooming in reveal more terrain detail?
Only if the digital map provides additional source detail at that zoom level. Enlarging the same map image makes its existing features bigger but does not add information.
Keep the terrain reading focused
Ask one question at a time: use spacing to compare gradients, bends to look for landforms, and labels to check elevation. Keep the legend visible while reading the map, especially where line styles or hachures are unfamiliar.
For a route decision, how to read contour lines on a topographic map comes down to combining the interval, spacing and shape without asking the contours to answer questions they cannot show. Mark a likely steep section or uncertain bend lightly in pencil, then compare it with paths and other mapped features. If the map leaves a crucial detail unclear, treat that uncertainty as part of the decision rather than filling it with an assumption.
Nearby ideas

Why North Sits at the Top of So Many Maps
Why north sits at the top of maps: understand how this familiar convention developed and decide…

How to Read a Transit Map Legend Before You Choose a Route
Learn how to read a transit map legend and distinguish routes, branches and transfers before you…